 Optencis
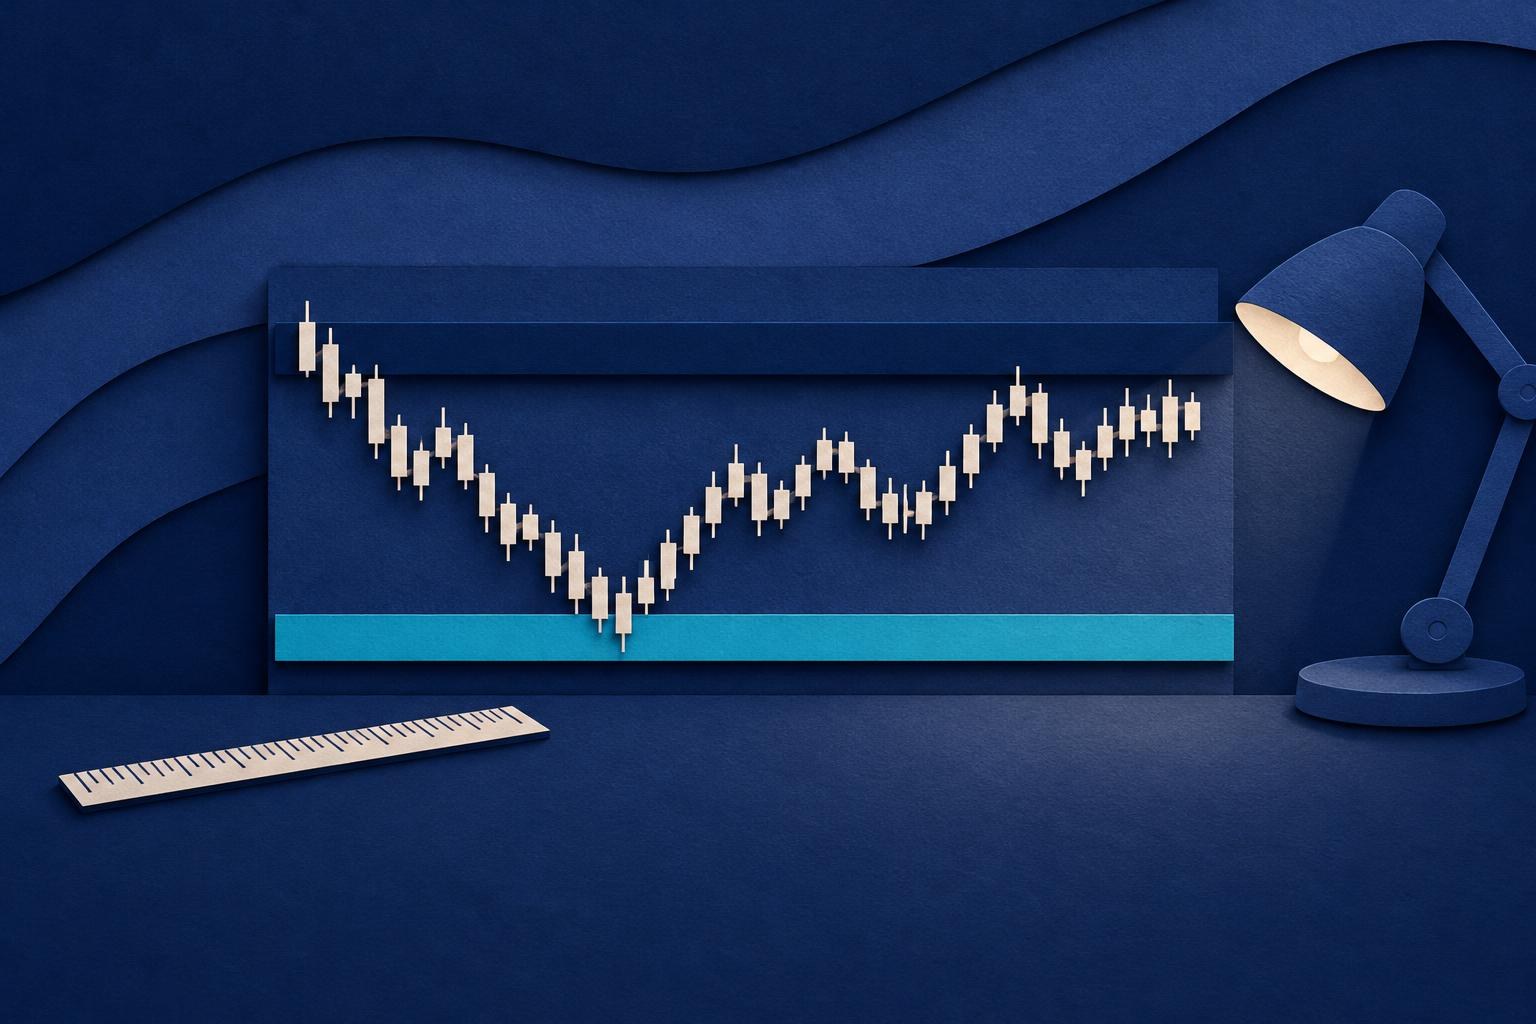
A support is a price area where a fall has stopped more than once; a resistance is an area where a rise has stopped more than once. They exist because traders remember prices: orders gather around the levels where the market turned before, and those orders slow the price down when it comes back. Reading them well gives you two things a trader needs most: a place where a move is likely to pause, and a clear point at which your idea is proven wrong.
Levels are areas, not lines. A support at 1.0850 on EUR/USD is really a zone of a few pips around that price, and the market will often poke through it by a little before turning. Draw your levels as bands, and expect some noise around them.
How to draw the levels that matter
- Zoom out first. Open a chart with four to six times more history than you trade on: the 1-hour chart if you trade on 15-minute candles, the daily chart if you trade on the hourly. The levels that matter are visible from far away.
- Mark the obvious turning points. Look for prices where the market reversed at least twice. The more times a level has held, and the stronger the reactions, the more it counts.
- Add the round numbers. 1.1000 on EUR/USD, 150.00 on USD/JPY, 2,000 on gold: round numbers attract orders and often act as levels on their own.
- Keep three to five levels. A chart covered in lines is a chart you can no longer read. Keep the nearest support, the nearest resistance and the next one on each side.
- Redraw every day. Levels age. Yesterday’s high becomes today’s resistance, and a level broken with force often changes role: an old resistance becomes a new support.
Bounce or breakout: the two things a level can do
| What you see | What it usually means | How traders use it |
|---|---|---|
| The price reaches the level, slows down, prints small candles with long wicks and turns | Bounce: the level holds | A trade in the direction of the bounce, with the level as the point where the idea fails |
| The price closes clearly beyond the level, with a large candle, then stays there | Breakout: the level gives way | A trade in the direction of the break, often after the price comes back to test the old level |
| The price pokes through the level, then closes back inside within a candle or two | False breakout | The most common trap for beginners; patience, then a trade back towards the middle of the range |
The key word in every case is close. A wick through a level means little; a candle that closes beyond it, on the timeframe you trade, means a lot more. Our article on reading candlesticks shows how to tell a rejection from a genuine break.
Levels in a trend and in a range
In a range, the price moves between a support and a resistance, and both levels get tested again and again. Trading the bounces from the edges towards the middle is the classic approach, and it works until the day the range breaks. In a trend, supports hold and resistances give way in an uptrend, and the opposite in a downtrend. The most useful trade is then the pullback to a support that used to be a resistance. Reading the trend first, as explained in our article on how to read a trend, tells you which behaviour to expect from your levels.
Using levels with a binary option
A binary option has no stop-loss: the trade is decided at expiry, and the loss is the whole amount invested. Levels are still useful, in two ways.
- As a reason to trade. A bounce from a level tested three times, in the direction of the trend, with a confirming candle, is a reason you can write down and check later. A trade taken in the middle of nowhere is not.
- As a reason not to trade. If a resistance sits just above the price and you are about to open an upward trade, the level may stop the move before your expiry. Wait for the break, or trade the bounce the other way.
Give the move time to happen: an expiry of three to five candles on your trading chart is a reasonable starting point, as discussed in our article on trade duration. And keep the amount fixed, 1% to 2% of your capital, so that a false breakout costs you a small loss and not a bad week.
Using levels with a stop-loss
In forex or CFDs, levels decide where your stop goes: a little beyond the level, where your idea is clearly wrong, not at a round distance chosen for comfort. The distance to that stop then decides your position size, as our position size calculator shows. Choosing the level first and the size second is what keeps the risk per trade constant.
Frequently asked questions
How do I know if a support is strong?
Count the touches and watch the reactions: a level that has turned the price three times with sharp rebounds, on a higher timeframe, is stronger than one touched once on a 1-minute chart. Round numbers and levels that coincide with a moving average add weight.
Why does the price break my level and then come back?
Because levels are zones and because orders sit just beyond them. A quick push through the level, followed by a close back inside, is a false breakout. Waiting for the close of the candle, rather than reacting to the wick, avoids most of these traps.
Can I use support and resistance on OTC assets?
You can draw them, but prices on OTC assets are set by the broker and do not carry the same order flow as a real market. Levels there are less reliable. Learn the method on real-market assets first.
Binary options and leveraged products are high-risk: you can lose all the money you invest. Read our binary options guide and our risk disclosure before trading.