 Optencis

A candlestick chart is the default view on almost every trading platform. Each candle sums up the price over one period, a minute, five minutes or an hour, in a single shape: where the price started, where it ended, and how far it went in between. Once you can read one candle, you can read the whole chart.
What a candle shows
| Part of the candle | What it tells you |
|---|---|
| The body | The distance between the opening price and the closing price of the period |
| The colour | Green (or white): the price closed higher than it opened. Red (or black): it closed lower |
| The upper wick | The highest price reached during the period |
| The lower wick | The lowest price reached during the period |
A green candle with a long body means buyers pushed the price up through most of the period. A long wick means the price went somewhere and was pushed back before the period ended.
Choose the timeframe first
Each candle covers one period, and you choose it: from a few seconds to a day. On the same asset, a 1-minute chart and a 1-hour chart can tell very different stories.
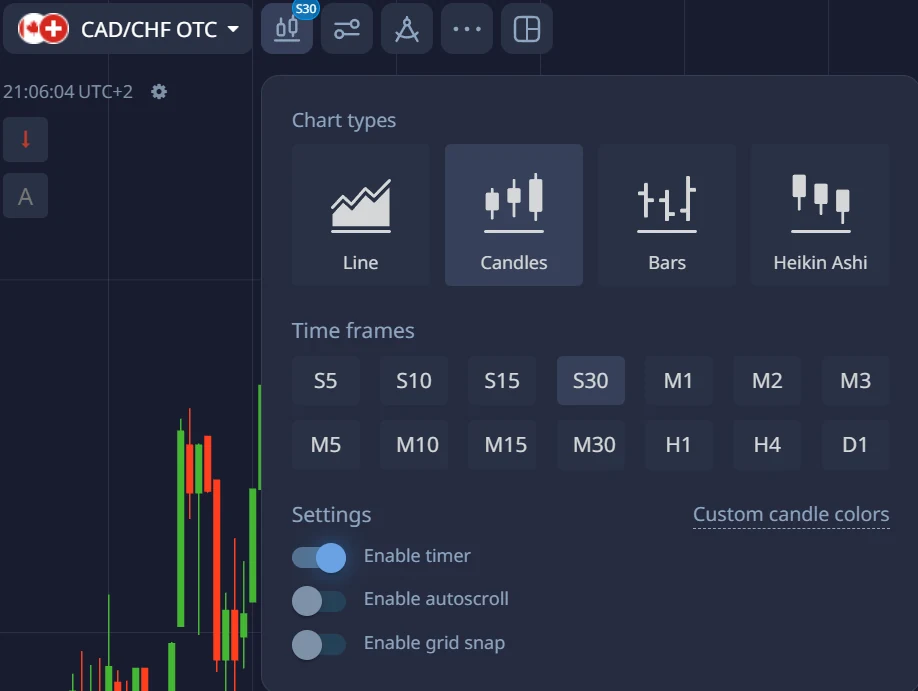
Match the timeframe to your expiry: a common approach is an expiry of about 3 to 5 candles, for example 15 to 25 minutes on a 5-minute chart. Our article on choosing your trade duration explains why very short timeframes leave too much to chance.
What the candles tell you
- Long bodies in the same direction: one side is clearly in control. Several in a row form a trend.
- A long wick: the price was rejected. A long lower wick near a support shows that buyers stepped in; a long upper wick near a resistance shows sellers did.
- A small body with wicks on both sides (a “doji”): buyers and sellers ended the period roughly even. It signals hesitation, not a direction.
- Bodies getting smaller after a strong move: the move is losing strength.
Patterns have names, such as the hammer (a small body with a long lower wick) or the engulfing candle (a body that covers the whole previous one). They are worth knowing, but none works on its own: a hammer in the middle of nowhere means little, the same hammer on a clear support means more.
Read the context, not one candle
- The trend: are the highs and lows rising, falling, or going sideways?
- The levels: where has the price turned before? Supports and resistances are where candles say the most.
- The clock: is a major release due? A calendar event can wipe out any pattern in seconds.
Our free lesson Read any chart in three questions walks through this method step by step.
Common mistakes
- Trading a single candle as if it were a signal.
- Using tiny timeframes: on 5-second candles, most of what you see is noise.
- Reading patterns on OTC assets as if they were the real market: their price comes from the platform. See what changes with OTC.
- Never checking the results: write down each pattern you trade in your trading journal and measure it over at least 100 trades, on the demo account first.
Frequently asked questions
What do the colours of the candles mean?
Green (or white) means the price closed above its opening level for that period; red (or black) means it closed below. Most platforms let you change the colours.
Which timeframe is best for binary options?
The one that matches your expiry. A common rule is an expiry of 3 to 5 candles: 5-minute candles for trades of 15 to 25 minutes, for example. Avoid timeframes of a few seconds while you learn.
Do candlestick patterns really work?
Not on their own. A pattern gives information about one moment; its value depends on where it appears (on a support, after a long move) and on the news. Only your own results, measured over many trades, tell you whether your way of using them works.
What is a doji?
A candle with a very small body and wicks on both sides: the price opened and closed at almost the same level. It shows hesitation between buyers and sellers.
Read our binary options guide for the basics. Binary options are high-risk products: you can lose all the money you invest.